
Food cost percentage is the share of a menu price, or of your total food sales, that goes to ingredients. It’s the number most restaurant pricing starts from, and it’s simple to calculate once you know the two versions of the formula. Below are both formulas, worked examples, what real restaurants run according to the National Restaurant Association, and a free recipe costing sheet you can download.
Download the free Recipe Costing Sheet (Excel, works in Google Sheets) →
The food cost percentage formula
Per plate (for pricing)
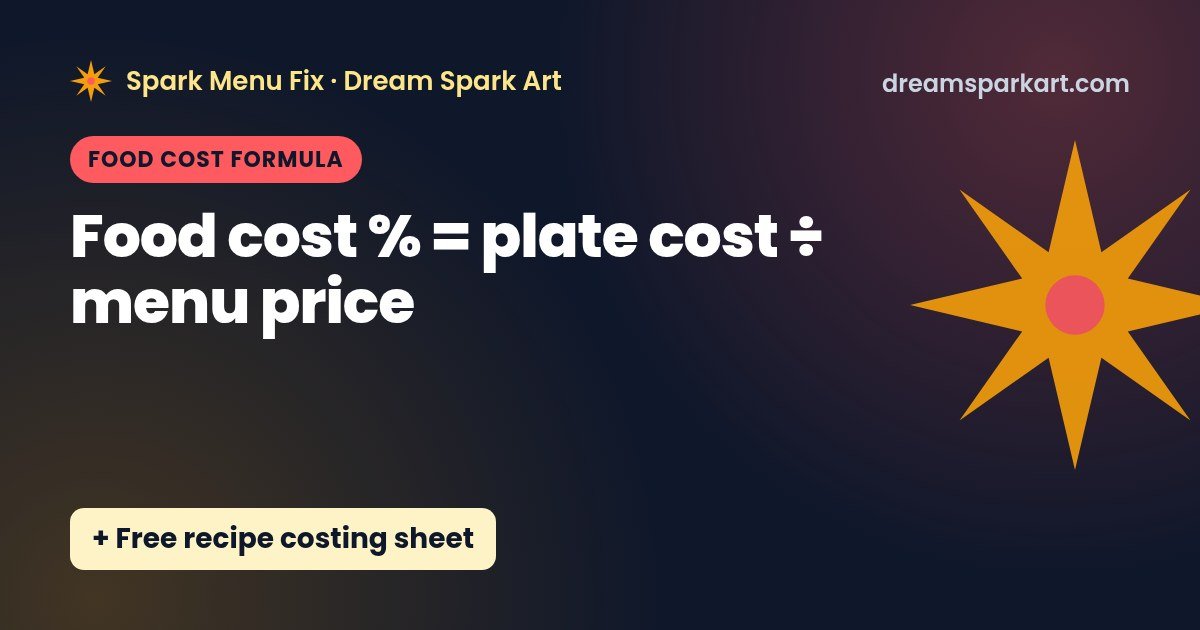
Food cost % = plate cost ÷ menu price × 100
Plate cost is the total cost of every ingredient in one portion. Use this version to set and check menu prices.
Per period (for your P&L)
Food cost % = (beginning inventory + purchases − ending inventory) ÷ food sales × 100
This is the formula OpenTable gives in its food cost guide. It measures what you actually used, including waste, over-portioning and theft, so it’s usually higher than your plate-cost math predicts. The gap between the two is worth watching.
Worked example 1: costing one plate
Example numbers for a fictional smash burger with fries, menu price $13.99. These are illustrative prices, not current market prices.
| Ingredient | Purchase price | Amount used | Line cost |
|---|---|---|---|
| Brioche bun | $5.40 per 12-pack | 1 bun | $0.45 |
| Ground beef 80/20 | $5.20 per lb | 6 oz (0.375 lb) | $1.95 |
| Cheddar | $6.00 per 20 slices | 1 slice | $0.30 |
| Tomato | $1.80 per lb, 90% usable | 1 oz | $0.13 |
| Lettuce + onion | n/a | 1 portion | $0.12 |
| House sauce | $0.12 per oz | 1 oz | $0.12 |
| Fries | $1.76 per lb | 5 oz | $0.55 |
| Ingredient subtotal | $3.62 | ||
| Q-factor 3% (oil, salt, garnish) | $0.11 | ||
| Plate cost | $3.72 | ||
Food cost % = $3.72 ÷ $13.99 = 26.6%.
Two details that make plate costs accurate
- Yield: if you trim or peel, cost the usable amount. Cost per usable unit = purchase cost ÷ yield %. At 90% yield, $1.80/lb tomatoes really cost $2.00 per usable lb.
- Q-factor: a small percentage added for ingredients too small to cost line by line (frying oil, seasoning, garnish). Adding a few percent is a common rule of thumb. Pick a number and use it consistently.
Worked example 2: monthly food cost
Example numbers:
- Beginning inventory: $8,000
- Purchases during the month: $14,000
- Ending inventory: $7,500
- Food sales: $46,000
Food cost % = ($8,000 + $14,000 − $7,500) ÷ $46,000 = $14,500 ÷ $46,000 = 31.5%.
If your plate costs say your menu should run around 27% but the month comes in at 31.5%, the difference points to waste, portioning, unrecorded comps or price increases you haven’t re-costed.
Pricing from a target food cost
Flip the formula to get a price:
Menu price = plate cost ÷ target food cost %
Example numbers: the $3.72 burger at a 30% target is $3.72 ÷ 0.30 = $12.41. At a 28% target it’s $13.30. The $13.99 price above sits under both targets, so it passes.
What’s a “good” food cost percentage?
Here’s what published sources say:
- National Restaurant Association (2024 data): in its 2025 Restaurant Operations Data Abstract, based on more than 900 operators, food and non-alcohol beverage costs were a median 32.4% of sales at limited-service restaurants and 32.0% at full-service restaurants. Source. The NRA notes these figures are not meant to be standards or goals for individual restaurants.
- By sales volume: the NRA also reported that higher-volume full-service restaurants tended to have lower food cost ratios in 2024. Source.
- Common target range: OpenTable says most thriving restaurants aim for food costs between 28% and 35% of food sales. Source.
Your right number depends on your concept. A steakhouse and a pizza shop will look very different. What matters most is your trend over time and the gap between plate cost and actual food cost.
Food cost on delivery apps
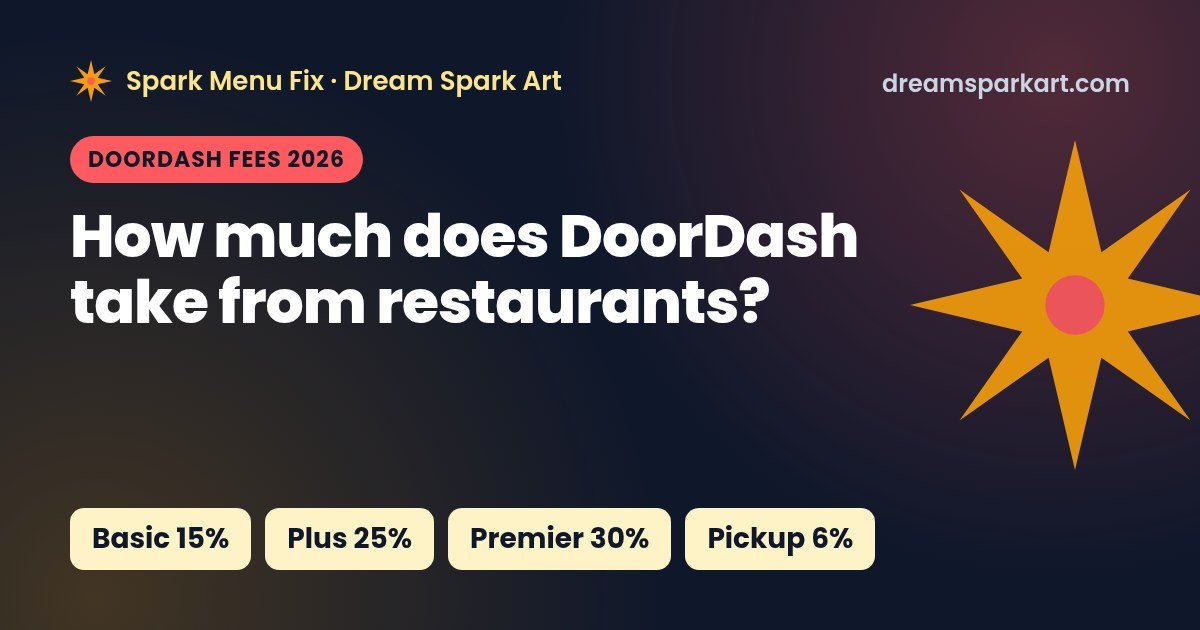
On DoorDash or Uber Eats, the app takes a commission (commonly 15–30% on their public US delivery plans), so the same plate cost eats a bigger share of what you receive. Example numbers: the $3.72 burger sold at $13.99 on a 30% plan pays out $9.79, so food is 38% of your payout, not 26.6%. See how to price your menu for delivery apps, or plug the numbers into our free commission calculator.
How to lower food cost without cutting quality
- Standardize portions: scoops, scales and plating photos at each station.
- Re-cost when prices move: update plate costs when a supplier invoice changes.
- Cross-use ingredients: fewer single-use items means less spoilage.
- Count inventory on a schedule and order to par levels so you don’t over-buy perishables.
- Engineer the menu: promote high-margin items and rethink low-margin ones that sell slowly.
Free recipe costing sheet
Our free sheet costs one recipe. Enter ingredient prices, pack sizes, amounts and yield, and it calculates plate cost, food cost % and a suggested price at your target. The example burger is pre-filled so you can see how it works.
Download the free Recipe Costing Sheet (.xlsx) → No email required.
Need to cost your whole menu?
Disclosure: the free sheet and calculator cost nothing. The templates below are our own products from Spark Menu Fix by Dream Spark Art. We earn money if you buy them. These are not affiliate links.
- Recipe Cost Calculator spreadsheet ($14.99): an ingredient library, multiple recipes and a menu summary of food cost % for every item. Etsy · Gumroad
- Restaurant Management Spreadsheet Bundle ($39): recipe costing, the delivery commission calculator, walk-in inventory with par levels, and shift checklists. Etsy · Gumroad
Want help pricing your delivery menu?
Spark Menu Fix offers a free 10-point delivery menu audit: items losing money after commission, pricing gaps, and photo and description fixes. Get your free audit → or email hello@dreamsparkart.com.
FAQ
What is the formula for food cost percentage?
Per plate: plate cost ÷ menu price × 100. Per period: (beginning inventory + purchases − ending inventory) ÷ food sales × 100.
What is a good food cost percentage for a restaurant?
OpenTable cites 28–35% as the range most thriving restaurants aim for. The National Restaurant Association reported 2024 medians of 32.4% for limited-service and 32.0% for full-service restaurants, while noting those figures aren’t goals for individual restaurants.
How do I price a menu item from food cost?
Divide plate cost by your target food cost percentage. A $3.72 plate at a 30% target is $12.41.
What is a Q-factor in recipe costing?
A small percentage added to plate cost for items too minor to cost individually, like oil, seasoning and garnish. A few percent is a common rule of thumb.
Why is my actual food cost higher than my recipe costs?
Period food cost captures waste, over-portioning, comps, theft and price increases that recipe cards miss. Compare the two every month.
Sources
- National Restaurant Association: Restaurant operators kept food cost ratios in check in 2024 (Sept 10, 2025)
- National Restaurant Association: Higher-volume restaurants reported lower food cost ratios in 2024
- OpenTable: How to Calculate Restaurant Food Cost Percentage
All ingredient prices and recipe numbers are illustrative example numbers. Not financial advice.